I was puzzled to receive a note from Full Fact, the fact-checking organisation, that seemed to accept Theresa May’s claim that housebuilding was at “record” levels. Her specific claim was that with a net gain of 217,000 units, more properties had been added to the English housing stock than at any other time in the last thirty years, apart from one year. That may be true, but it’s a funny sort of “record”. The second-best result during a period of deeply inadequate policy is hardly something to crow about – a bit like celebrating April’s higher rainfall in the Sahara. August in the Sahara is wetter than April anyway, but it’s still a desert.
Housebuilding figures used to figure regularly in Social Trends; I’ve taken this figure, showing GB figures, from the 2000 edition. 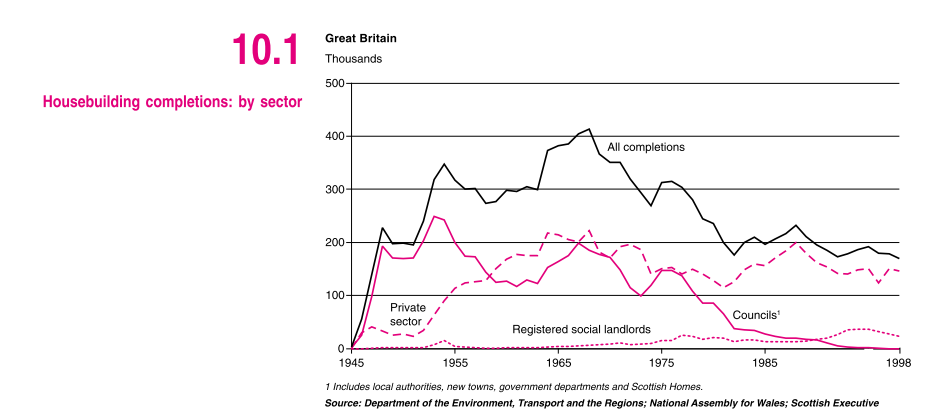 Between 1950 and 1979, the average number of net additions to the housing stock in the UK were never less than 230,000, and at the highest point (1960-69) the average was 259,000. This was at a time when both population and household numbers were significantly lower: the old measure, the number of units added per 1000 persons in the population, fell starkly after the 1970s. It also makes a difference where the properties are – we long ago gave up moving work to where people actually lived.
The numbers matter. If there are not enough houses, then people just have to live where they can, including property that is unfit or managing in someone else’s household. Usually in a market the people who get left out in the competition for resources are the ones who are least able to pay, but housing doesn’t work as a pure market – people in prior occupation get to keep out people who don’t yet have what they need. Ultimately, however, it’s a matter of maths: if there are more households than houses, someone, somewhere has got to be homeless.