David Webster has sent me a picture; let me share it with you.
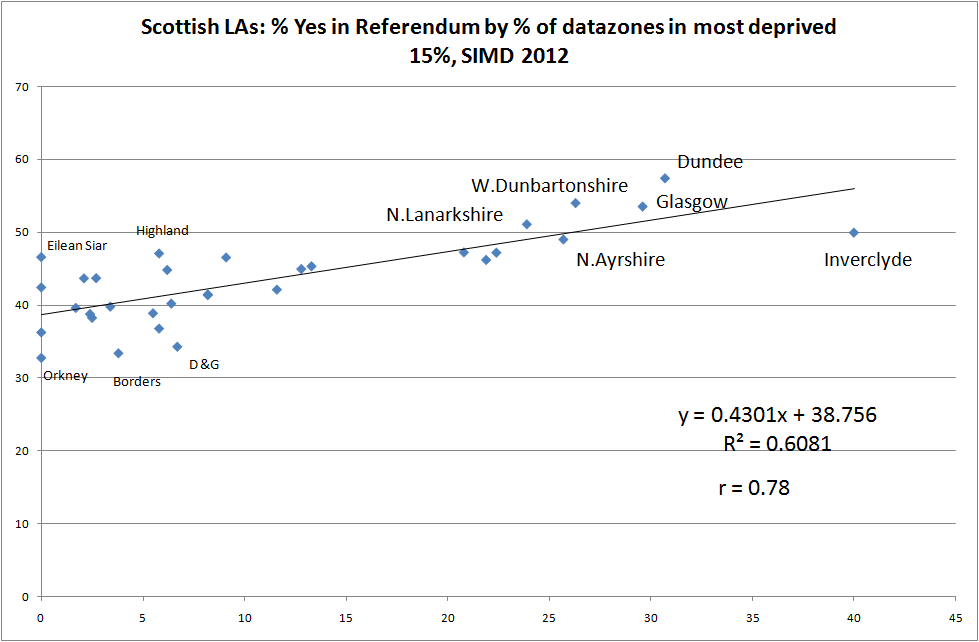
What it shows is that “Over 60% of the variation in ‘Yes’ vote share between local authorities can be explained by the single variable ‘proportion of datazones in the LA which are in the most deprived 15% in Scotland’.”
And here’s another from David:
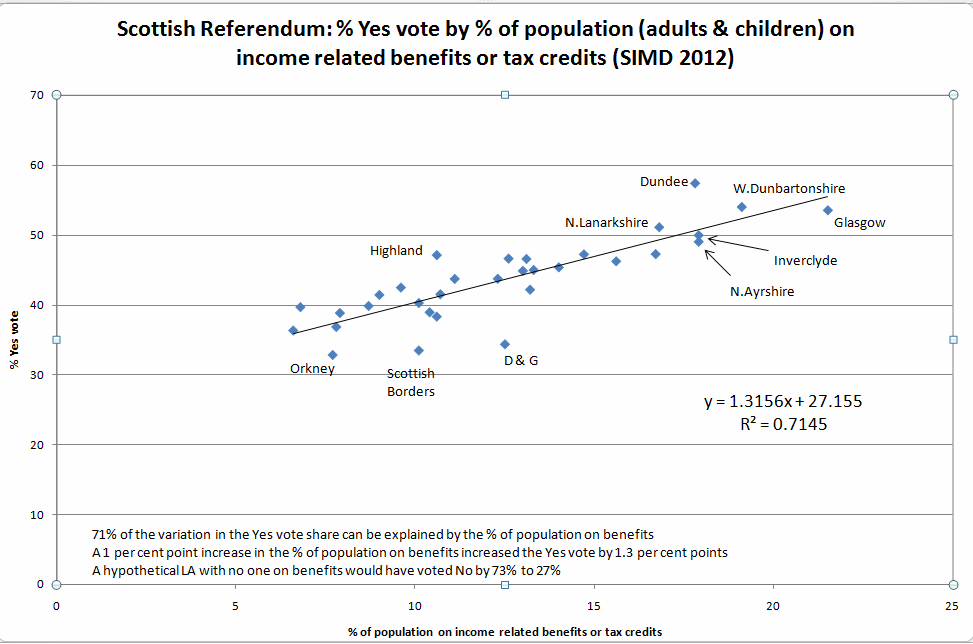
This seems right but what other variables were included in the regression model? This effect could be much less noticeable if other influential variables are included.